CarbCam – How does it work?
How does CarbCam work?
CarbCam takes your photo, sends it to an AI service, receives an estimate of the components, validates the values against standard nutrition databases, and shows you the result.
Process overview
Every analysis goes through up to six steps:
Visualised flow — followed by the real screenshots for comparison:
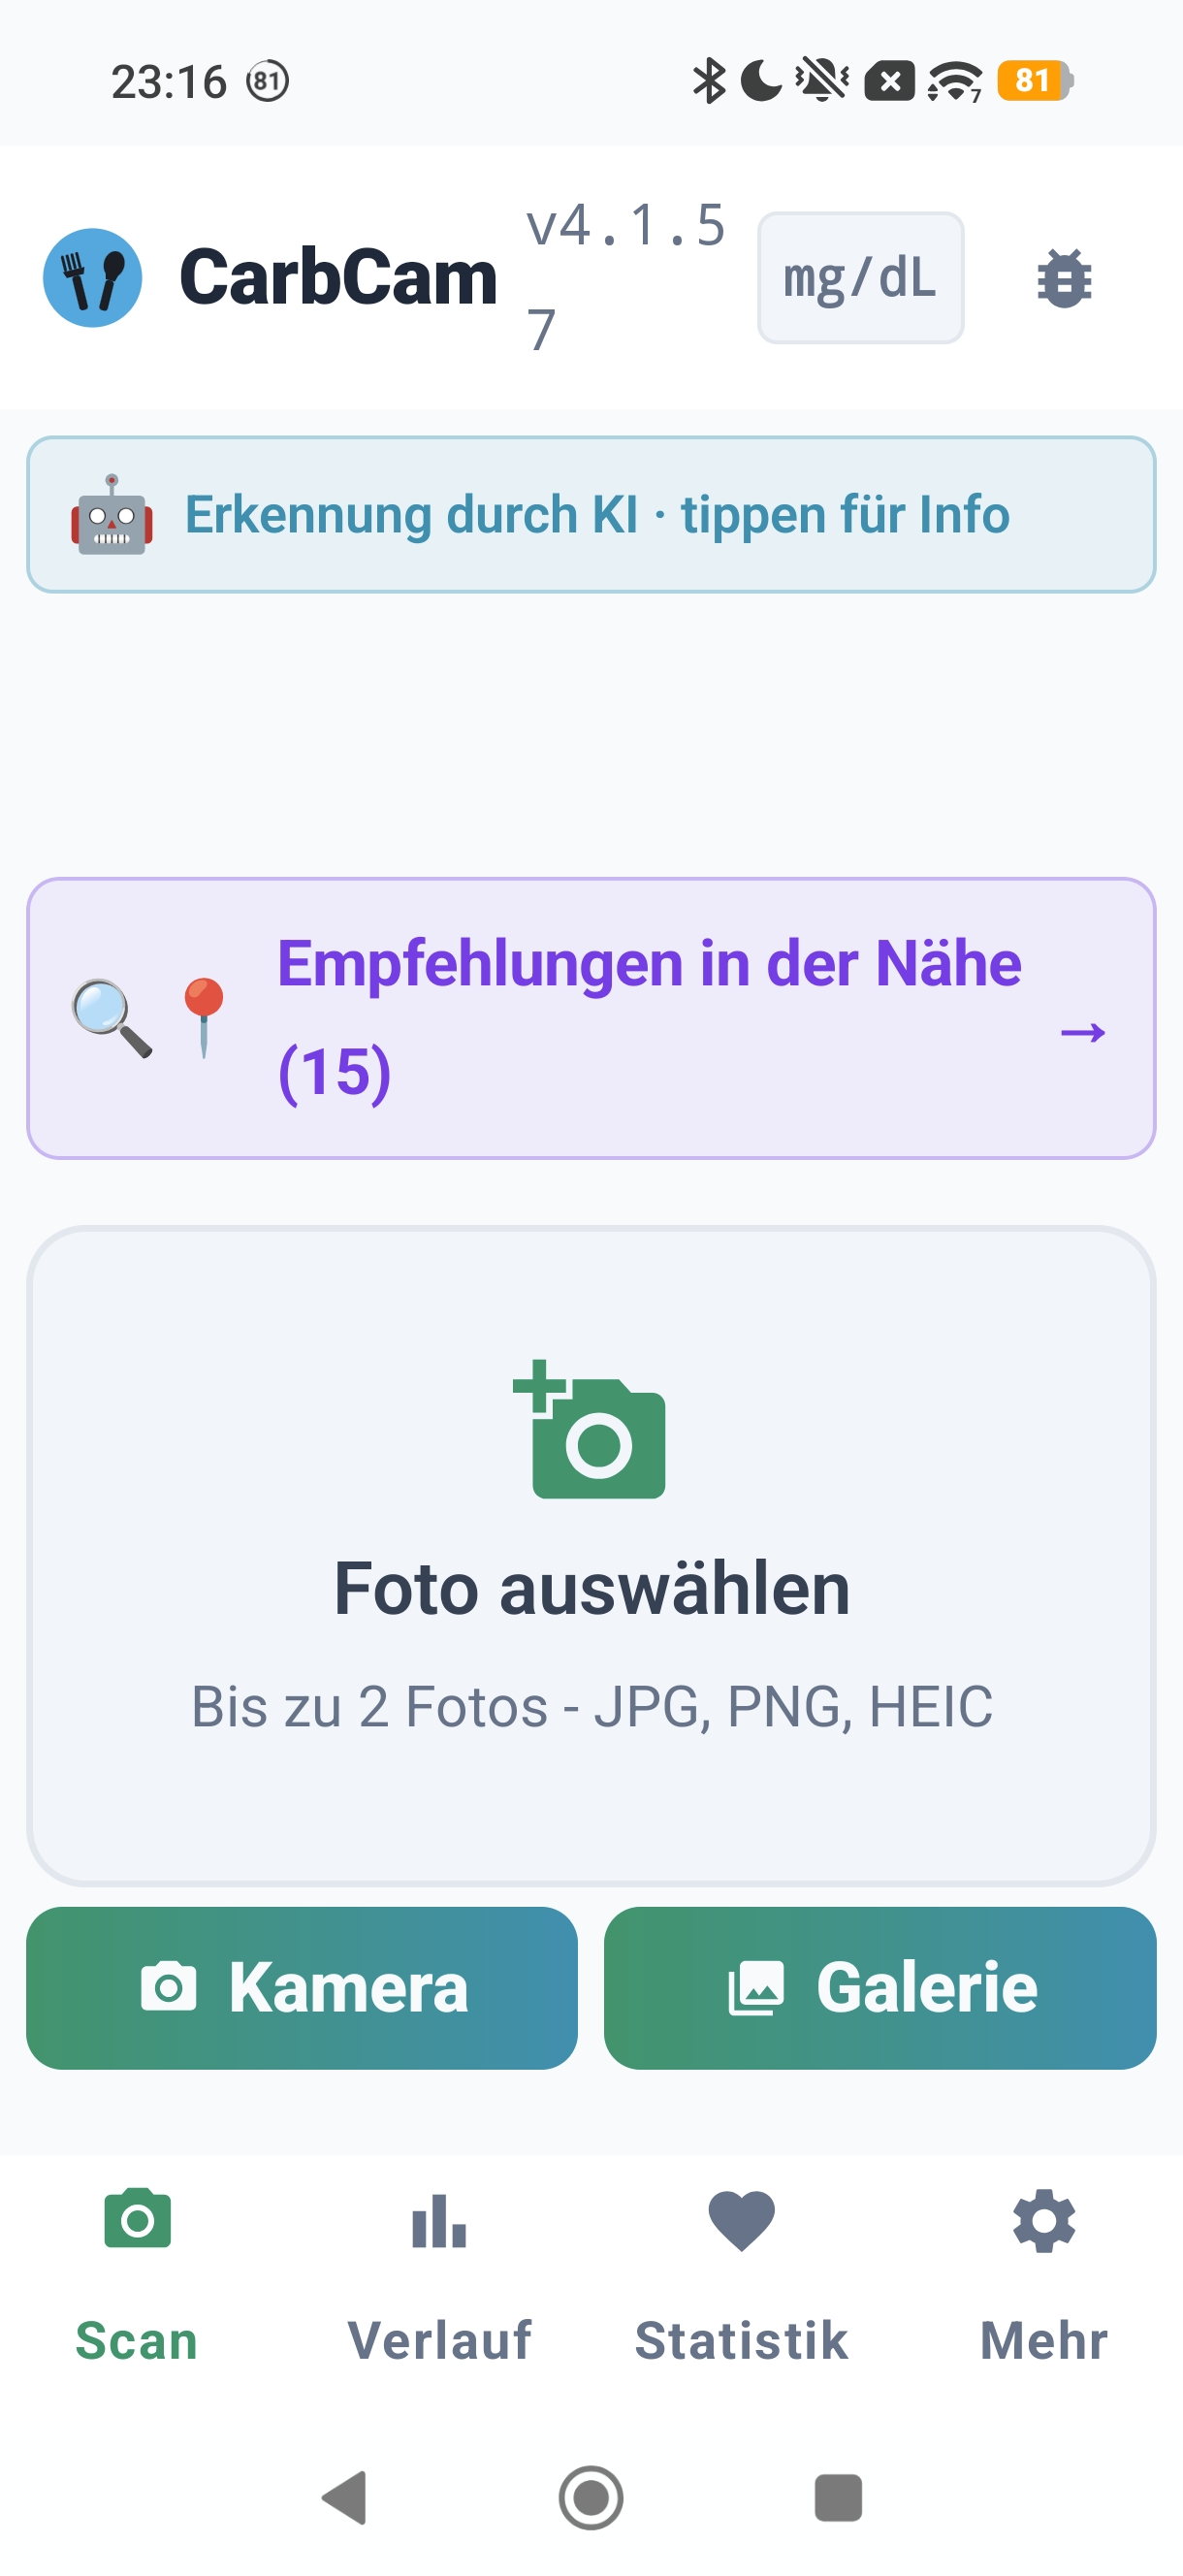
1. Scan tab
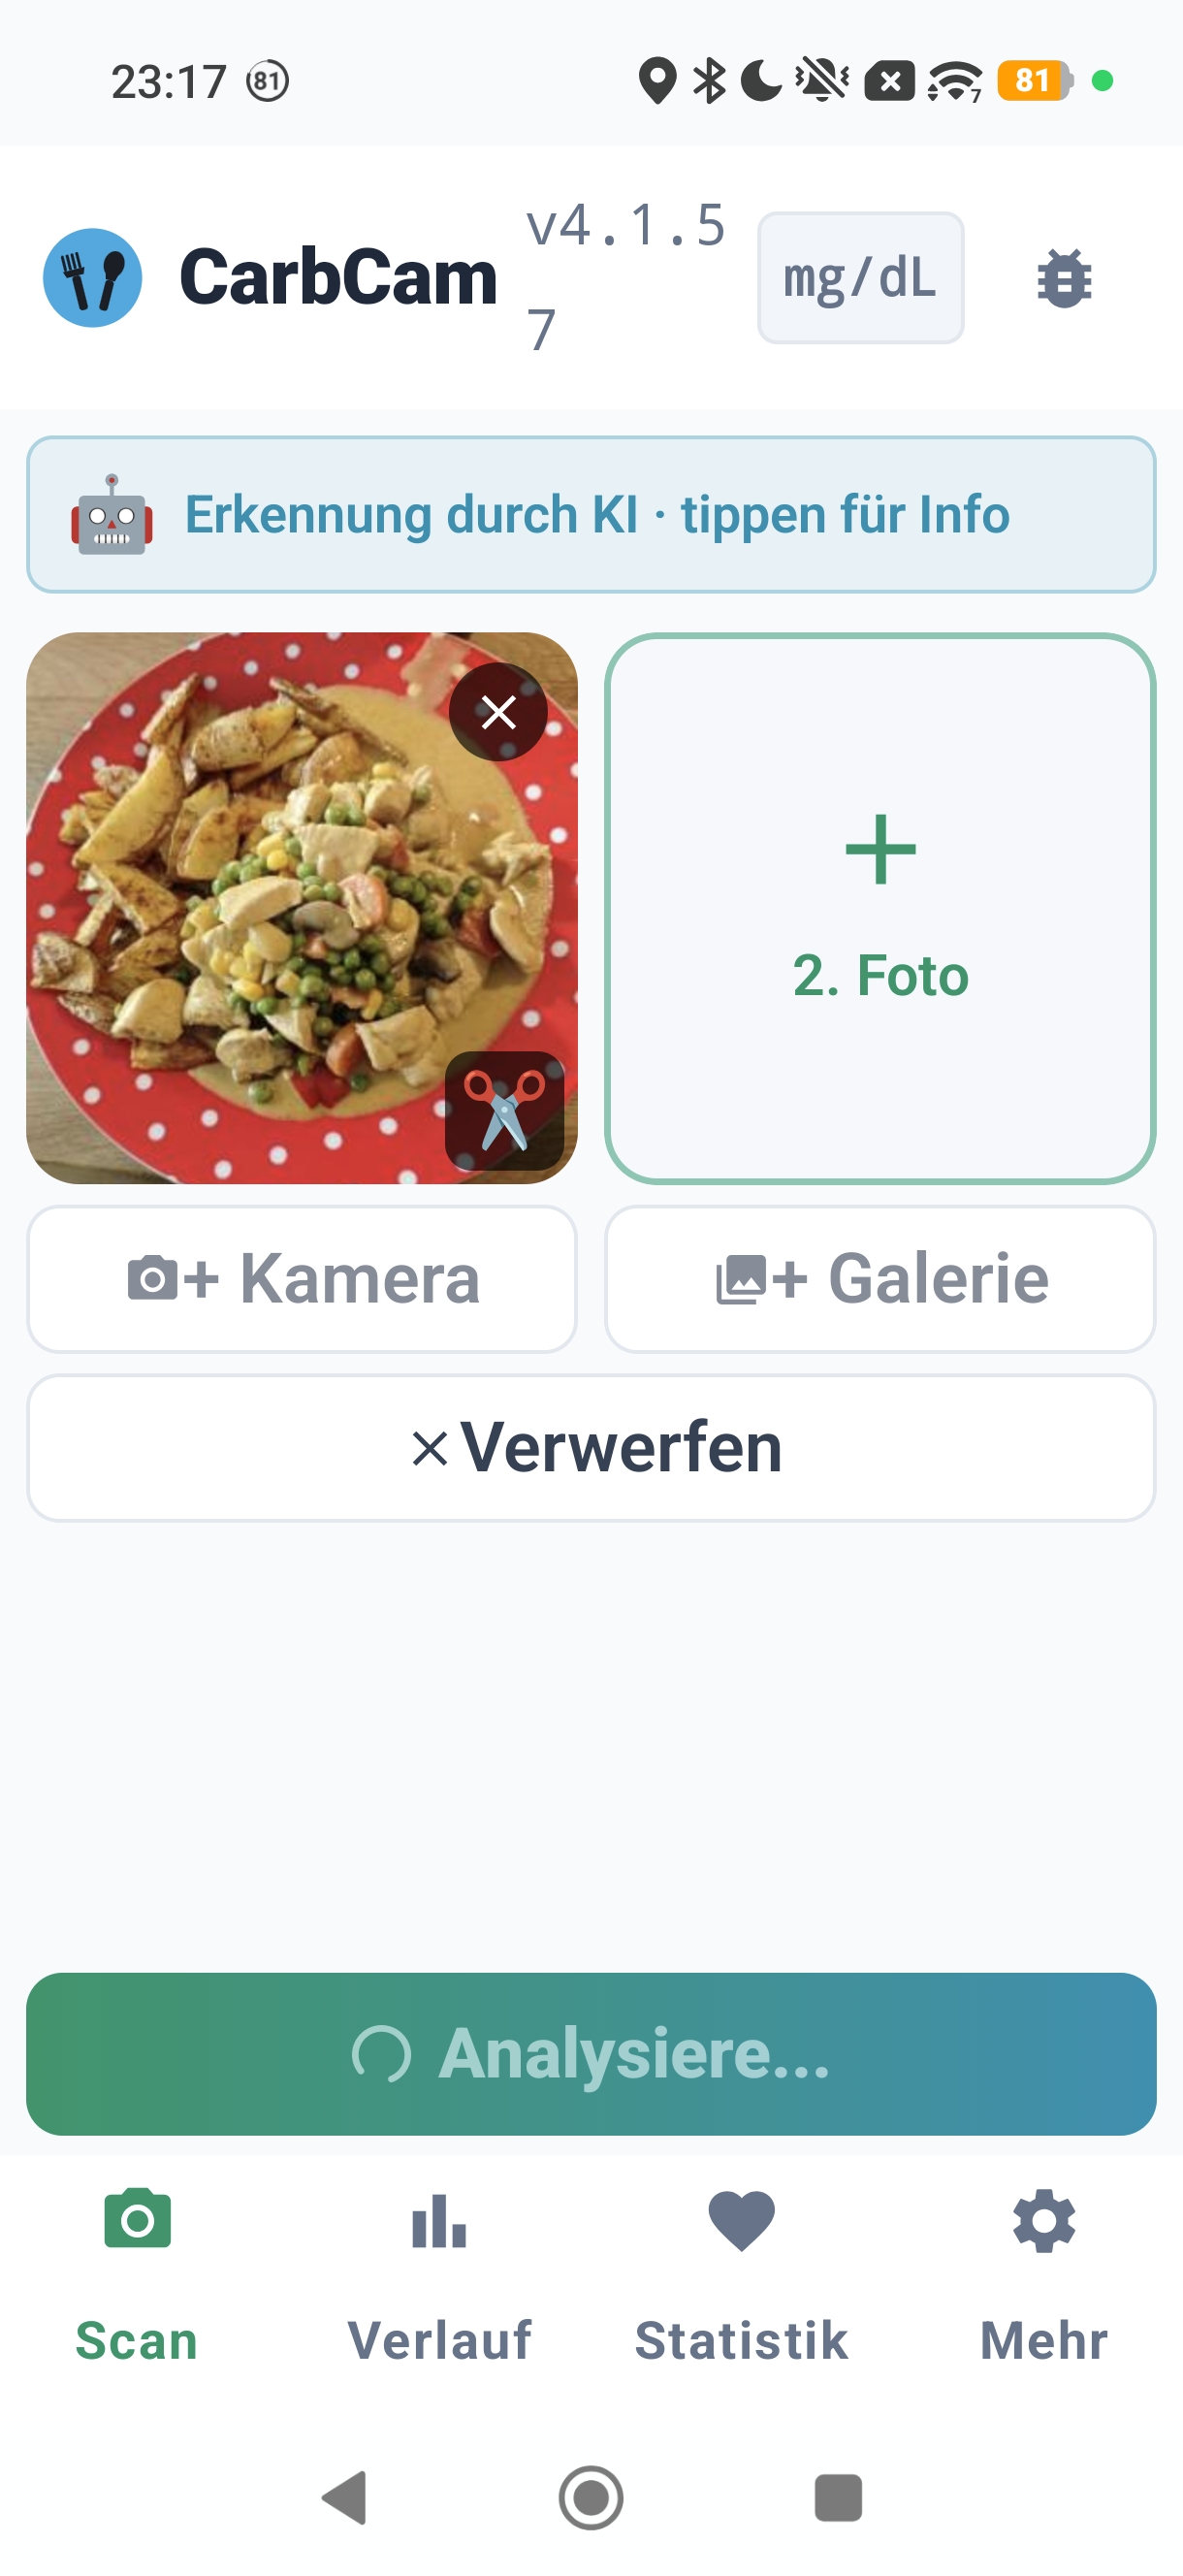
2. AI analysis
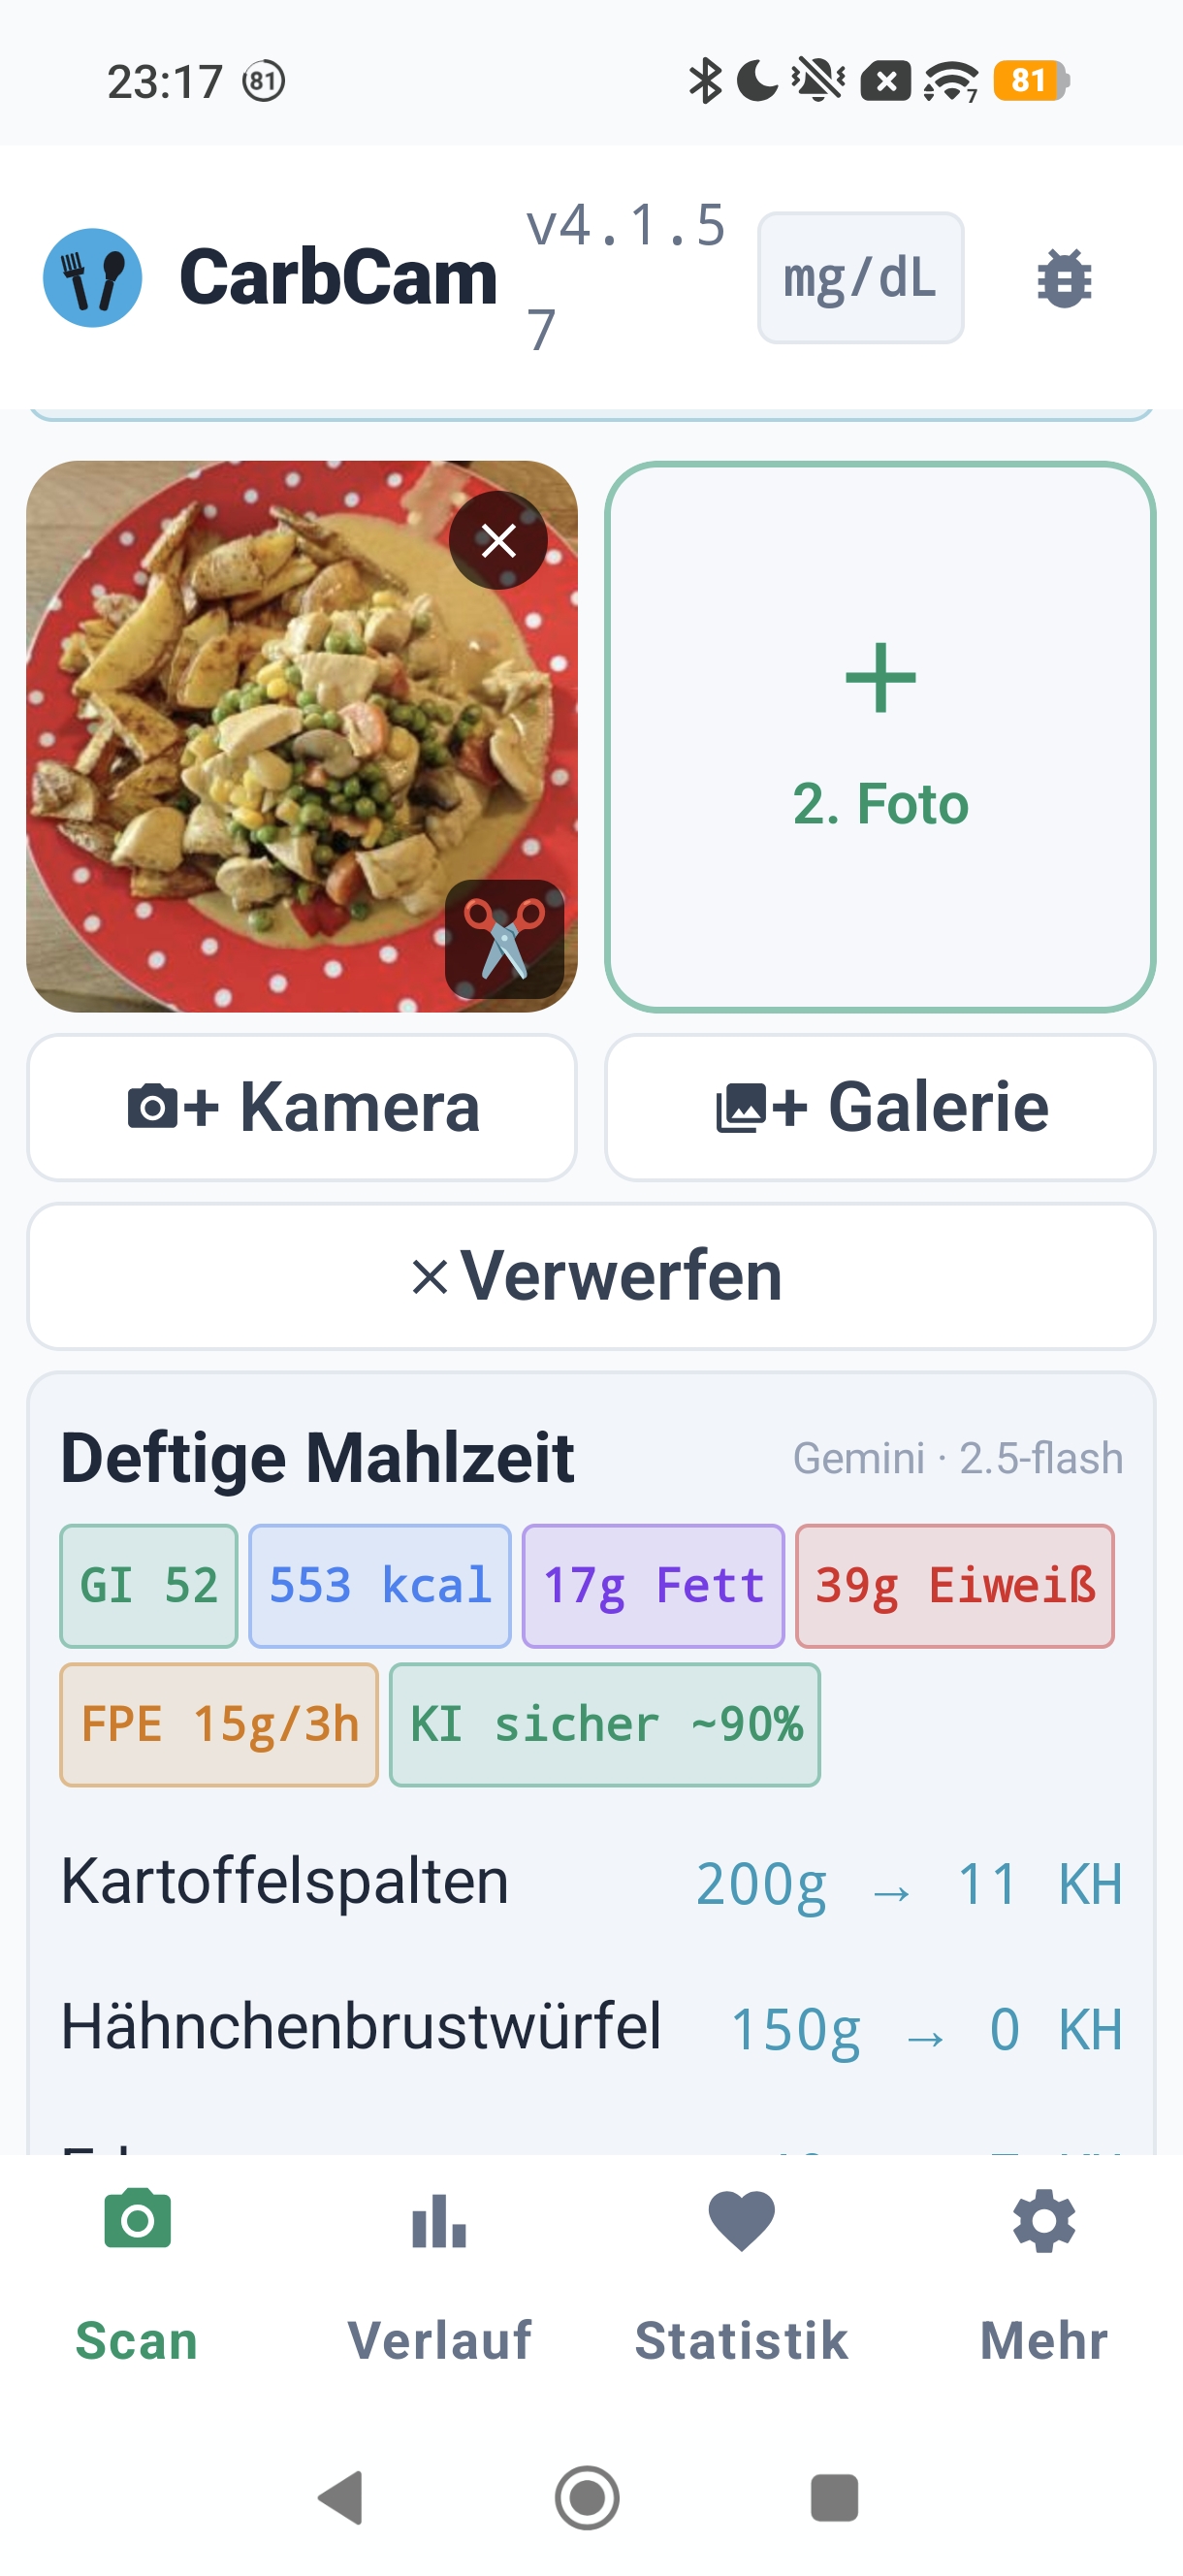
3. Result
Process in detail
1 Photo capture & local image trimming
The photo initially stays entirely on your device. You can crop, rotate, or retake it. Nothing is uploaded until you tap “Analyze”.
2 Server cache query (Precheck)
Before the image is sent to the AI at all, the app checks via SHA-512 hash and perceptual hash whether an identical or very similar photo already exists in the server cache. If there is a hit, you get the stored result back immediately — without another AI call. A subsequent Confirm step marks the cache entry as consumed (quota counting).
3 Upload to AI analysis
If there is no cache hit, the (cropped) photo is sent to our analysis endpoint. A vision model (Gemini, Claude or OpenAI — depending on your choice in the app settings) is called there to describe the image, name the individual components, and estimate rough quantities.
4 Background validation (low confidence only)
If the AI estimate reports a low confidence, the server starts a background cross-check against nutrition databases (USDA FoodData Central, Open Food Facts). The corrected values feed into the cache — the next time the same or a similar photo is matched, you see the improved result. For scans with high confidence this step is skipped.
For barcodes, however, the Open Food Facts / USDA comparison is always performed directly, since the manufacturer nutrition table is the primary source here.
5 Editing by you
You can override any value — quantity, carbs, kcal, FPE, component. When saving, your values are used, not the AI estimate. The app stores your total carb correction (User: Xg vs AI: Yg) as a difference for statistical purposes.
6 Save & Nightscout sync
Locally in a SQLite database. Optionally also via Nightscout sync to your Nightscout instance — but only as a note in the treatment table
(with the tag CarbCam), not as an active carb/insulin treatment.
Your Loop/AAPS/iAPS calculations are not affected by CarbCam saves — the meal is only visible as a note.
If you use Managed Nightscout from ns.10be.de, setup is especially easy: enter the Nightscout URL and API secret — done.
If you want carbs actively as a treatment, use the Share button in the scan result — it sends the carb value via deep link to AAPS/AndroidAPS, Loop, iAPS or Trio or opens the system share sheet.
What is FPE?
FPE stands for Fat-Protein Units. They describe how much energy from fat and protein affects blood glucose with a delay.
One FPE equals approximately 100 kcal from fat and protein. Example:
- 30 g fat + 20 g protein = (270 + 80) ÷ 100 = 3.5 FPE
Pump users often use FPE to set the extended bolus parameters (e.g. square-wave or dual-wave). Pen users can use FPE as a rough indicator for a late correction snack or a small afternoon correction.
CarbCam displays FPE as a yellow chip in the result card. The nutritional value colors:
- Carbs Carbohydrates
- kcal Calories
- FPE Fat-Protein Units
- Fat Fat
- Protein Protein
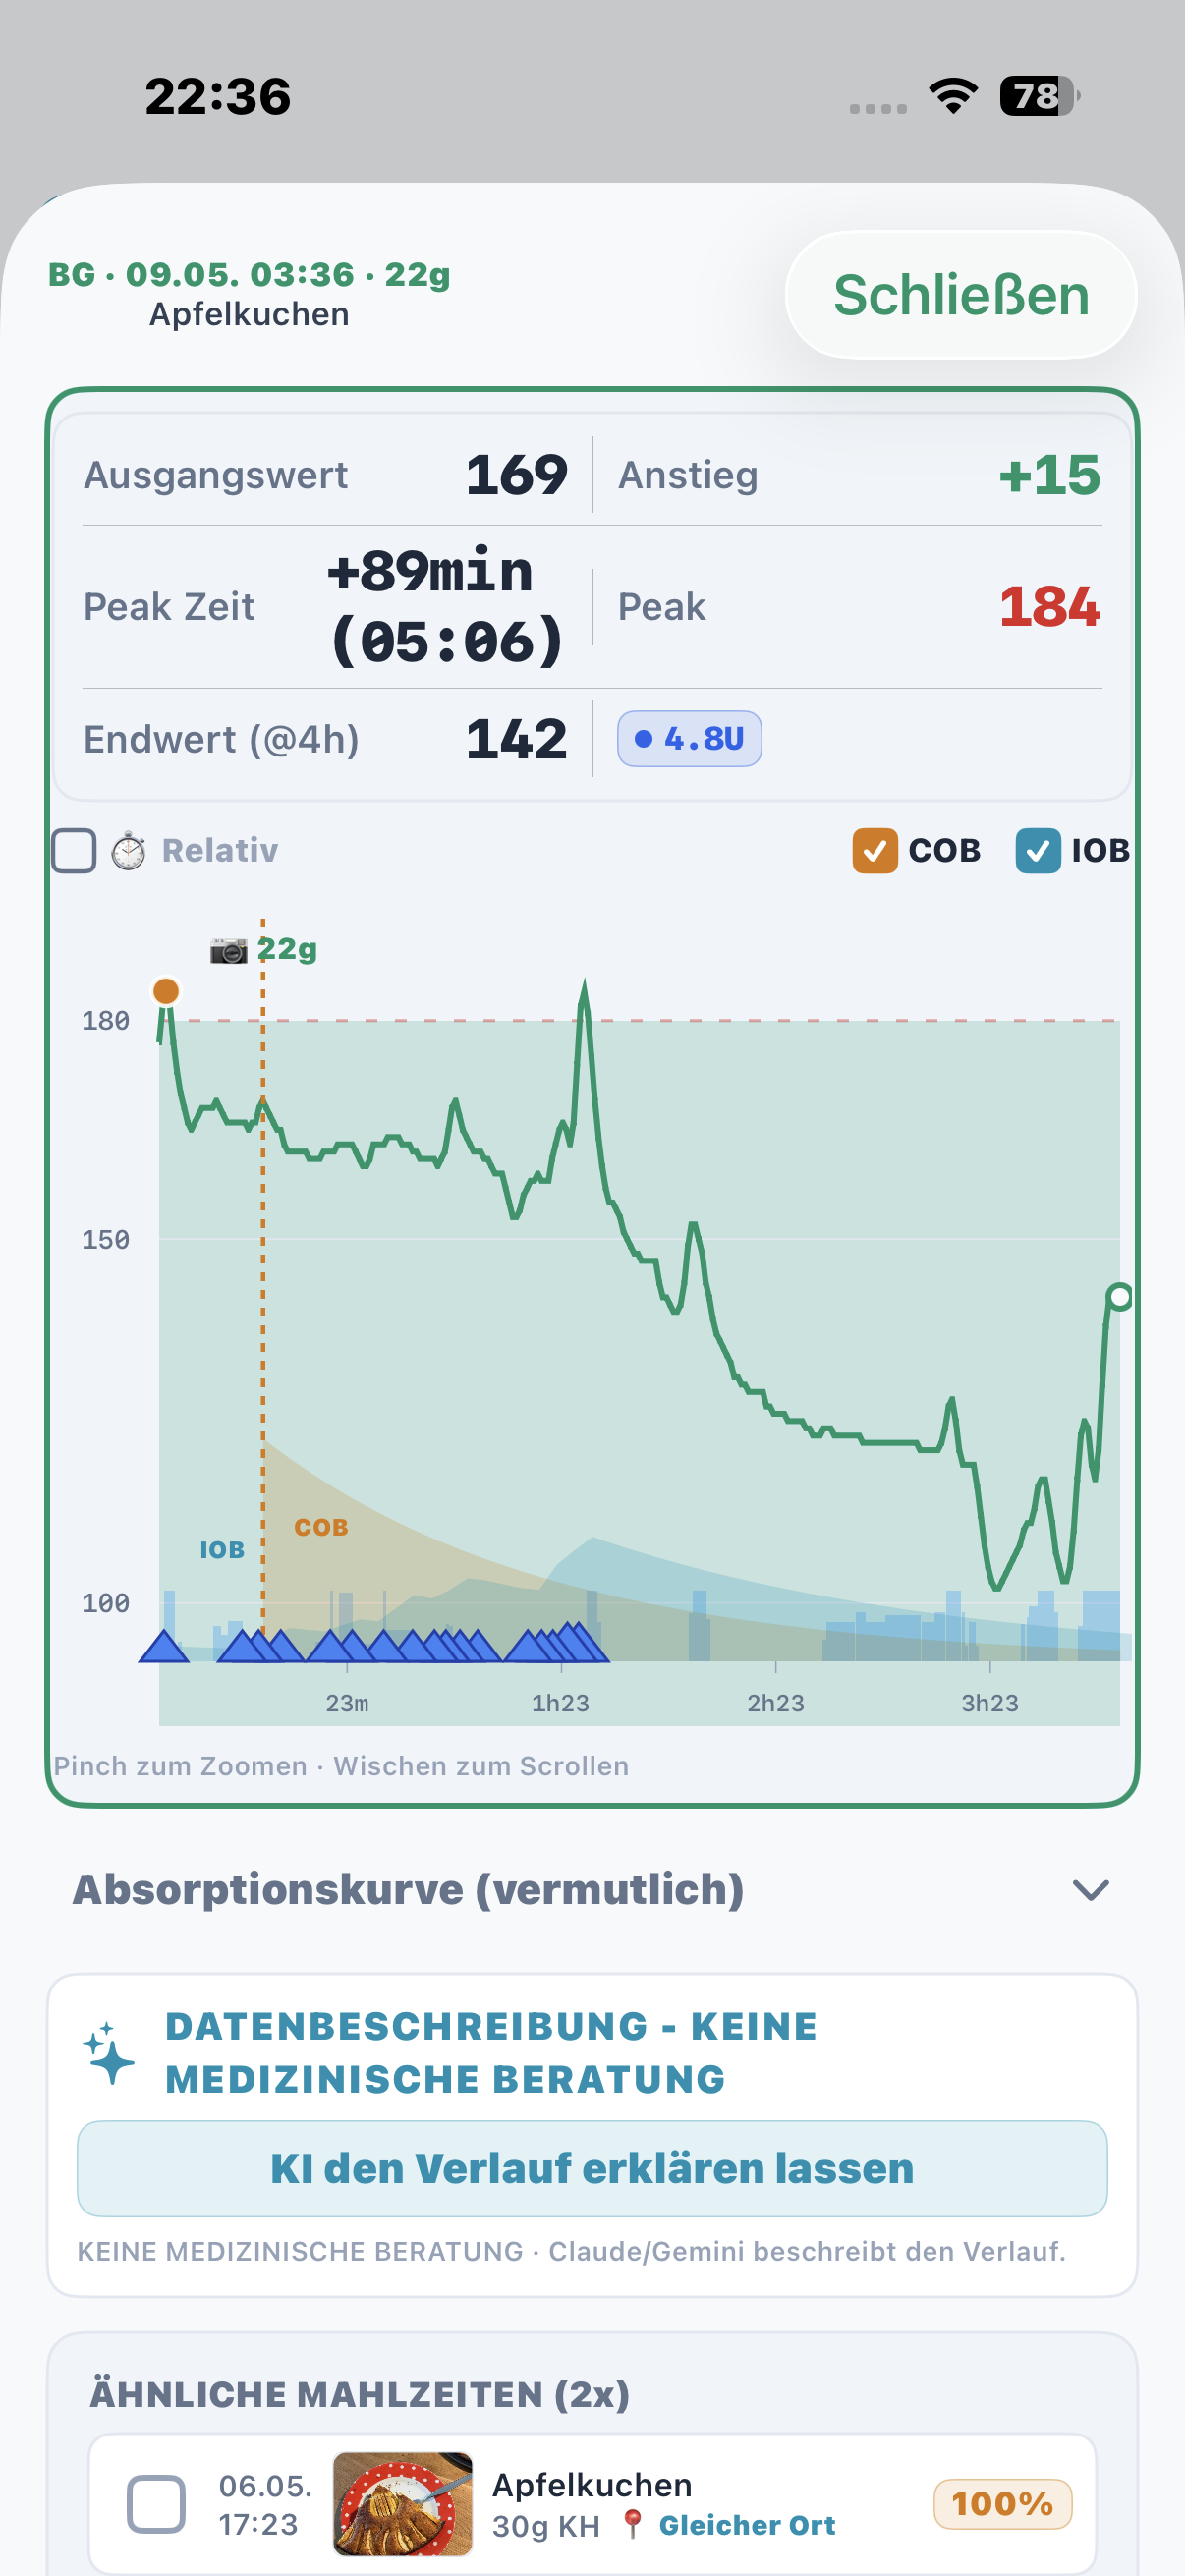
BG curve below the meal
When Nightscout is configured, CarbCam loads BG data from your Nightscout instance and shows the blood glucose curve in the history tab below each meal. The time window is platform-dependent and is automatically chosen around the meal. Together with Nightscout, CarbCam enables targeted post-meal BG tracking.
Features of the BG curve (Nightscout data):
- Time window around the meal (platform-dependent)
- Marker for the meal time
- Peak point highlighted in color (red/yellow/green depending on level)
- Rise and end value as key metrics
- IOB / COB as optional overlay lines
Accuracy
Accuracy depends on the meal type:
| Meal type | Typical deviation | Examples |
|---|---|---|
| Clear portions | ±20 % | Rice, pasta, bread |
| Complex meals | ±30 % | Stew, casseroles |
| Very unusual | ±40 % or more | Unknown regional dishes |
| Packaged products | ±5 % | Automatic barcode detection (manufacturer value via Open Food Facts) |
What improves accuracy:
- Good lighting & clear photo — no shadows over the plate
- All components visible — don’t drown the pasta in sauce
- Size reference — keep the plate edge, cutlery, or hand in the frame
- Standard dishes — the AI is good at well-known dishes
What reduces accuracy:
- Buffet plates with many small piles
- Components heavily covered in sauce
- Very unusual regional dishes without a clear reference database
- Photographed at an angle from the side without a size reference
What this means for your bolus:
- For normal meals: use the estimate as a starting point, apply your own knowledge, and adjust the value before saving if needed
- For critical bolus decisions (very high carbs, hypo risk): always consult your own knowledge / database / packaging
- With a pump: gain experience on how much your meals typically deviate — then correct the estimate with your personal factor
What happens offline?
Without an internet connection the following features work:
- Browse and filter history
- Manually create and edit entries
- View the stats tab
- Export data (CSV/JSON)
- Take photos and queue them for later analysis
The following requires a connection:
- AI analysis (photo is sent to the provider)
- Automatic barcode lookup (Open Food Facts)
- Nightscout sync (BG curve, treatment upload)